


Downtowns across America have been reporting this week news that downtowns are recovering and once again seeing the numbers of visitors in their downtown nearing or surpassing the levels last seen pre-pandemic in 2019.
Of the 26 downtowns in the study released by Center City Philadelphia, few have matched the rebound of San Jose.
Gathering cell phone usage to track the numbers of visits, visitors and time spent on its mobile analytics platform, Placer.ai can compare annual data before and since the COVID outbreak.
“The findings demonstrate that recovery is definitely happening, for some communities faster than for others,” said SJDA CEO Alex Stettinski at SJDA’s Annual Meeting on Oct. 13. “Downtown San Jose ranked high in a few key areas.”
In one example, San Jose had eclipsed by 5 percent the number of visitors downtown in the second quarter of 2023 vs. the same quarter of 2019! Only two other cities in the study — Phoenix and Nashville — had better visitors numbers than San Jose, and only those three cities had eclipsed 2019 levels. The fourth best result in that category was Fort Worth, TX, which had reached only 82 percent of pre-pandemic levels.
Another statistic showed that San Jose in 2023 has nearly equaled the number of residents living downtown four years ago. While San Jose’s resident total is now just 5 percent below the 2019 level — second best among the cities studied — only San Diego’s downtown population has matched its 2019 numbers.
“This is promising data and shows that attracting visitors to downtown is trending up,” Stettinski said. “What’s lacking is the office workforce we were used to in 2019, which is something we need to address but harder to control. The shift back to office environments has been gradual in San Jose, with a 30-40 percent recovery rate since the pandemic.”
The Placer.ai data was corroborated by the data collected from similar means by the University of Toronto/School of Cities. The most recent report out of Toronto showed that from early March to mid-June, San Jose had achieved 96 percent return of visitors compared to the same period pre-Covid in 2019. That was third best of 55 U.S. cities — only Las Vegas had eclipsed 2019 levels with 103%, and El Paso, TX, with 97 percent recovery. Only Bakersfield (95%), Oklahoma City (93%), Miami (92%) and Tucson (91%) joined Tucson by doing better than 90 percent recovery in that category.
Placer.ai now provides customized data to SJDA
 Thanks to a grant from the Knight Foundation, SJDA has become a Placer.ai subscriber and can now dig deep on cell phone usage by residents, workers and visitors in our downtown’s core. For its “Building San Jose Back Better” initiative, SJDA analyzes Business Improvement District boundaries bordered by I-280 on the south, Fourth Street on the east, Highway 87 on the west and Julian Street on the north, with additional BID coverage areas around SAP Center and the San Jose Market Center on Coleman Avenue.
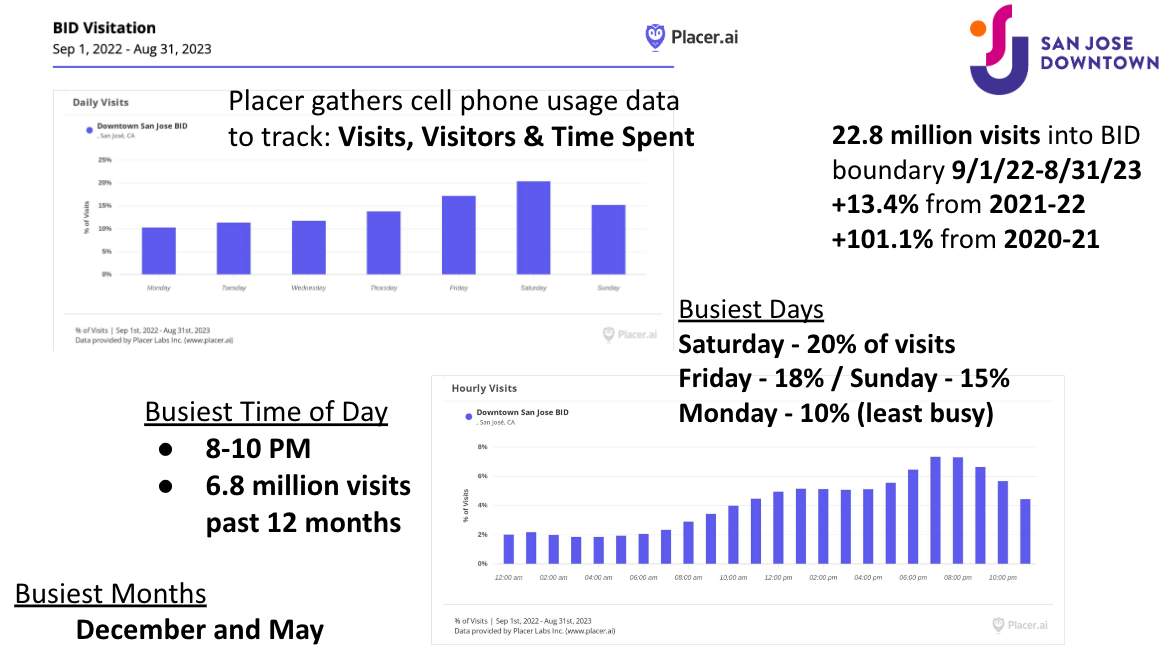
Some top-line downtown metrics taken from the 12 months Sept. 1, 2022-Aug. 31, 2023 show that downtown’s busiest times are after traditional work hours and weekends:
- San Jose’s downtown core experienced 22.8 million visitors, a 13.4 increase over the previous year and more than double the number of visitors in 2022-21.
- More than half the visits occurred Friday-Sunday. Saturday visits represented 20 percent of the total. Friday was the second busiest day at 18 percent of total visits, and Sunday was next with 15%. Monday was the slowest day at 10 percent.
- Busiest time: 8-10 p.m., when 6.8 million people — 30 percent of the total — visited downtown.
- Busiest months are December, when Downtown for the Holidays is busy all afternoon and evening, and May for Mother’s Day, graduations and the start of San Jose’s outdoor events season.
“Placer.ai enables us to produce detailed reports about foot traffic, where people are coming from and how long they are staying,” Stettinski said. “The data will help us better understand how, why, when, and who is using our downtown and public spaces.”
“We’re applying a more data- and research-driven approach to our programs in hopes of bringing vibrancy and foot traffic to downtown for many years to come.”
SJDA’s grant with Knight Foundation is entering its third of five years.
Reference links
Center City Philadelphia:
A data-driven path to recovery for U.S. downtowns; San Jose ranks second best
University of Toronto:
San Jose third best on list of 66 cities monitored for downtown recovery
SF Chronicle:
Downtown S.F. woes not as bad as originally thought, revised report says


